
***Â This post was originally published in ACRL TechConnect on Dec. 4, 2013. ***
Libraries make much use of spreadsheets. Spreadsheets are easy to create, and most library staff are familiar with how to use them. But they can quickly get unwieldy as more and more data are entered. The more rows and columns a spreadsheet has, the more difficult it is to browse and quickly identify specific information. Creating a searchable web application with a database at the back-end is a good solution since it will let users to quickly perform a custom search and filter out unnecessary information. But due to the staff time and expertise it requires, creating a full-fledged searchable web database application is not always a feasible option at many libraries.
Creating a MS Access custom database or using a free service such as Zoho can be an alternative to creating a searchable web database application. But providing a read-only view for MS Access database can be tricky although possible. MS Access is also software locally installed in each PC and therefore not necessarily available for the library staff when they are not with their work PCs on which MS Access is installed. Zoho Creator offers a way to easily convert a spreadsheet into a database, but its free version service has very limited features such as maximum 3 users, 1,000 records, and 200 MB storage.
Google Visualization API Query Language provides a quick and easy way to query a Google spreadsheet and return and display a selective set of data without actually converting a spreadsheet into a database. You can display the query result in the form of a HTML table, which can be served as a stand-alone webpage. All you have to do is to construct a custom URL.
A free version of Google spreadsheet has a limit in size and complexity. For example, one free Google spreadsheet can have no more than 400, 000 total cells. But you can purchase more Google Drive storage and also query multiple Google spreadsheets (or even your own custom databases) by using Google Visualization API Query Language and Google Chart Libraries together. (This will be the topic of my next post. You can also see the examples of using Google Chart Libraries and Google Visualization API Query Language together in my presentation slides at the end of this post.)
In this post, I will explain the parameters of Google Visualization API Query Language and how to construct a custom URL that will query, return, and display a selective set of data in the form of an HTML page.
A. Display a Google Spreadsheet as an HTML page
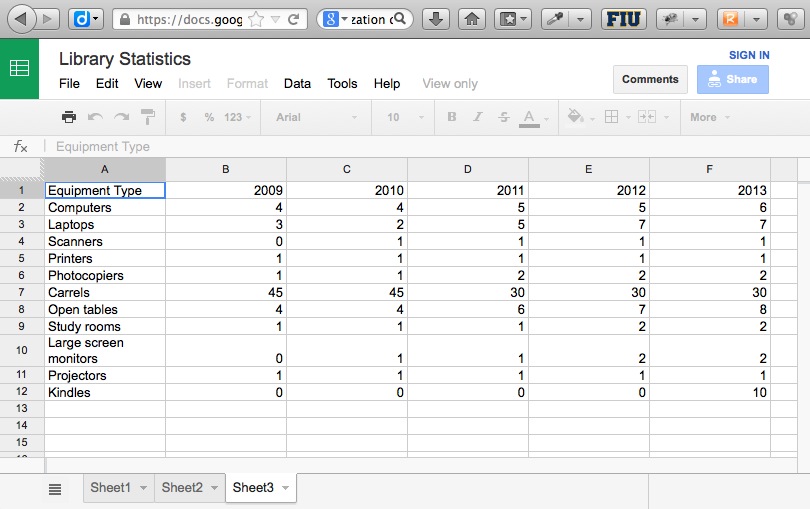
The first step is to identify the URL of the Google spreadsheet of your choice.
The URL below opens up the third sheet (Sheet 3) of a specific Google spreadsheet. There are two parameters you need to pay attention inside the URL: key and gid.
This breaks down the parameters in a way that is easier to view:
- https://docs.google.com/spreadsheet/ccc
?key=0AqAPbBT_k2VUdDc3aC1xS2o0c2ZmaVpOQWkyY0l1eVE
&usp=drive_web
#gid=2
Key is a unique identifier to each Google spreadsheet. So you need to use that to cretee a custom URL later that will query and display the data in this spreadsheet. Gid specifies which sheet in the spreadsheet you are opening up. The gid for the first sheet is 0; the gid for the third sheet is 2.
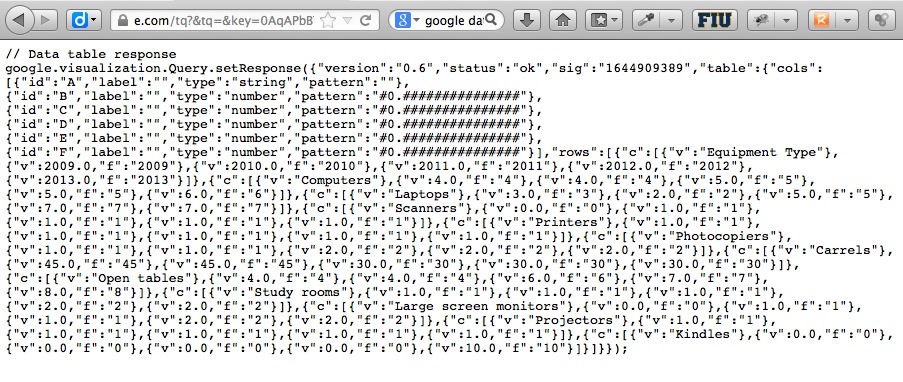
Let’s first see how Google Visualization API returns the spreadsheet data as a DataTable object. This is only for those who are curious about what goes on behind the scenes. You can see that for this view, the URL is slightly different but the values of the key and the gid parameter stay the same.
https://spreadsheets.google.com/tq?&tq=&key=0AqAPbBT_k2VUdDc3aC1xS2o0c2ZmaVpOQWkyY0l1eVE&gid=2
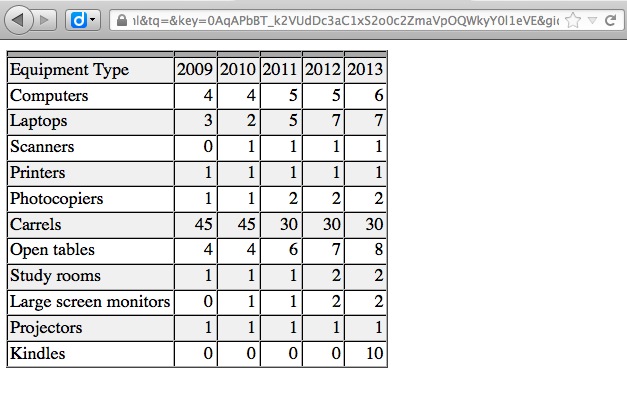
In order to display the same result as an independent HTML page, all you need to do is to take the key and the gid parameter values of your own Google spreadsheet and construct the custom URL following the same pattern shown below.
- https://spreadsheets.google.com
/tq?tqx=out:html&tq=
&key=0AqAPbBT_k2VUdDc3aC1xS2o0c2ZmaVpOQWkyY0l1eVE
&gid=2
B. How to Query a Google Spreadsheet
We have seen how to create a URL to show an entire sheet of a Google spreadsheet as an HTML page above. Now let’s do some querying, so that we can pick and choose what data the table is going to display instead of the whole sheet. That’s where the Query Language comes in handy.
Here is an example spreadsheet with over 50 columns and 500 rows.
- https://docs.google.com/spreadsheet/ccc?
key=0AqAPbBT_k2VUdDFYamtHdkFqVHZ4VXZXSVVraGxacEE
&usp=drive_web
#gid=0
https://docs.google.com/spreadsheet/ccc?key=0AqAPbBT_k2VUdDFYamtHdkFqVHZ4VXZXSVVraGxacEE&usp=drive_web#gid=0
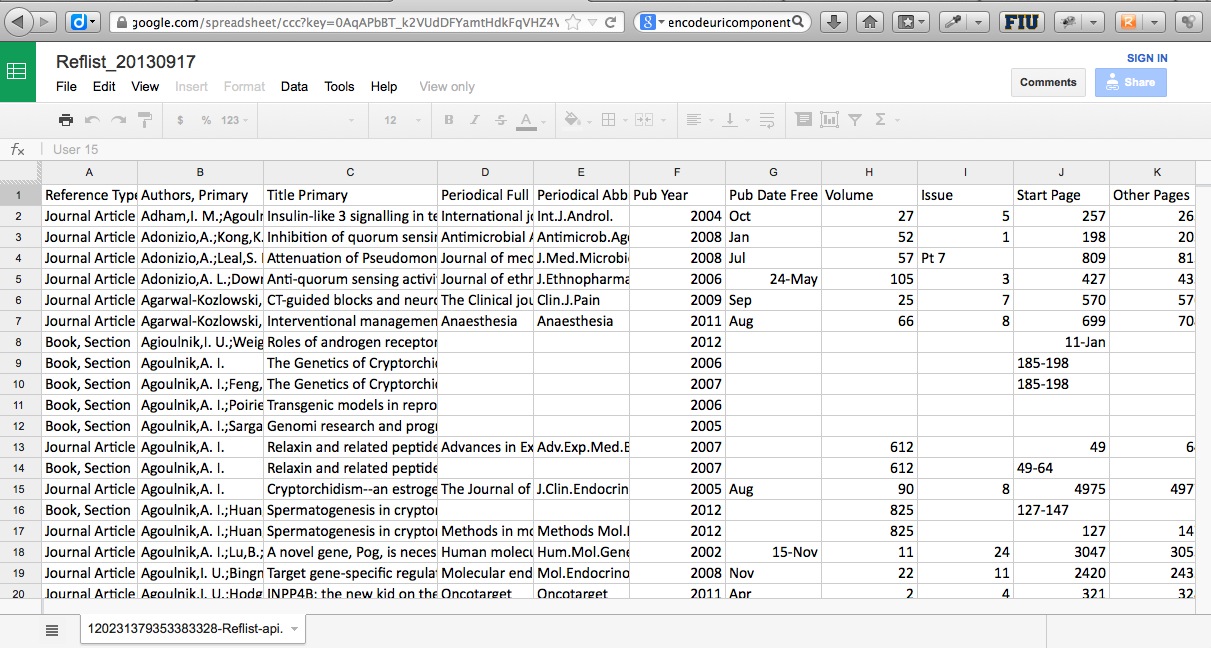
What I want to do is to show only column B, C, D, F where C contains ‘Florida.’ How do I do this? Remember the URL we created to show the entire sheet above?
- https://spreadsheets.google.com/tq?tqx=out:html&tq=&key=___&gid=___
There we had no value for the tq parameter. This is where we insert our query.
Google Visualization API Query Language is pretty much the same as SQL. So if you are familiar with SQL, forming a query is dead simple. If you aren’t SQL is also easy to learn.
- The query should be written like this:
SELECT B, C, D, F WHERE C CONTAINS ‘Florida’
- After encoding it properly, you get something like this:
SELECT%20B%2C%20C%2C%20D%2C%20F%20WHERE%20C%20CONTAINS%20%27Florida%27
- Add it to the tq parameter and don’t forget to also specify the key:
https://spreadsheets.google.com/tq?tqx=out:html&tq=SELECT%20B%2C%20C%2C%20D%2C%20F%20WHERE%20C%20CONTAINS%20%27Florida%27
&key=0AqAPbBT_k2VUdEtXYXdLdjM0TXY1YUVhMk9jeUQ0NkE
I am omitting the gid parameter here because there is only one sheet in this spreadsheet but you can add it if you would like. You can also omit it if the sheet you want is the first sheet. Ta-da!
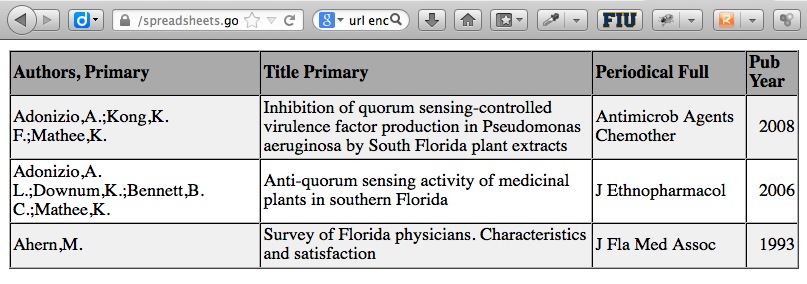
Compare this with the original spreadsheet view. I am sure you can appreciate how the small effort put into creating a URL pays back in terms of viewing an unwieldy large spreadsheet manageable.
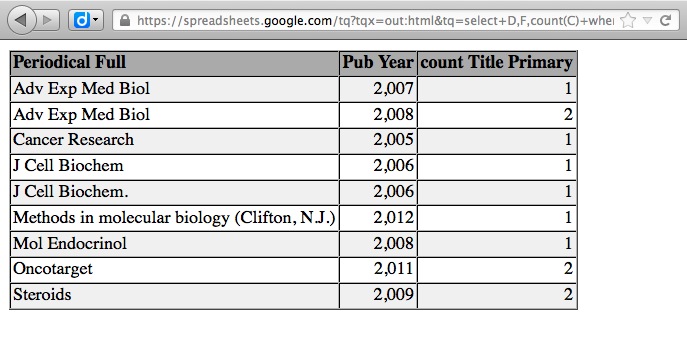
You can also easily incorporate functions such as count() or sum() into your query to get an overview of the data you have in the spreadsheet.
- select D,F count(C) where (B contains ‘author name’) group by D, F
For example, this query above shows how many articles a specific author published per year in each journal. The screenshot of the result is below and you can see it for yourself here: https://spreadsheets.google.com/tq?tqx=out:html&tq=select+D,F,count(C)+where+%28B+contains+%27Agoulnik%27%29+group+by+D,F&key=0AqAPbBT_k2VUdEtXYXdLdjM0TXY1YUVhMk9jeUQ0NkE
Take this spread sheet as another example.
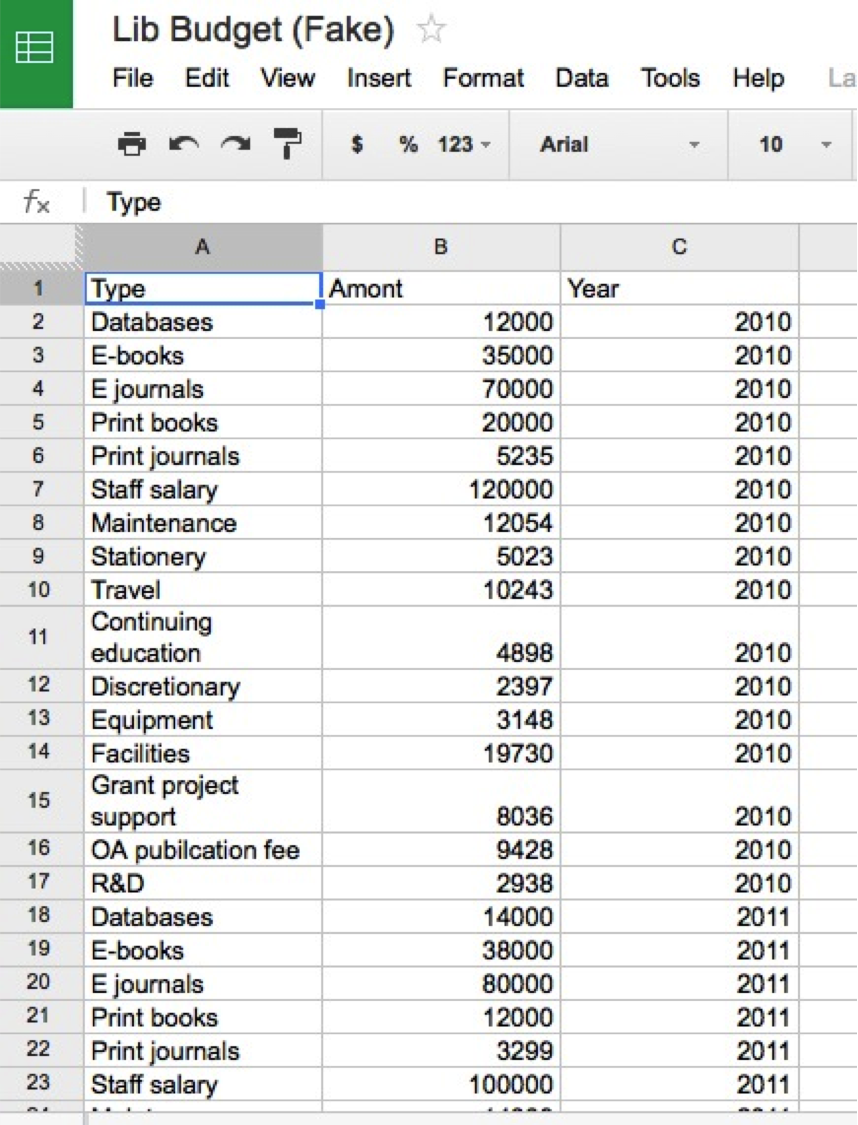
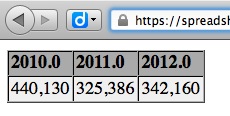
This simple query below displays the library budget by year. For those who are unfamiliar with ‘pivot‘, pivot table is a data summarization tool. The query below asks the spreadsheet to calculate the total of all the values in the B column (Budget amount for each category) by the values found in the C column (Years).
- select sum(B) pivot C
https://spreadsheets.google.com/tq?tqx=out:html&tq=select%20sum%28B%29%20pivot%28C%29&key=0AqAPbBT_k2VUdHg4X08zMXFMeXRmdURJNUx5blpYUmc
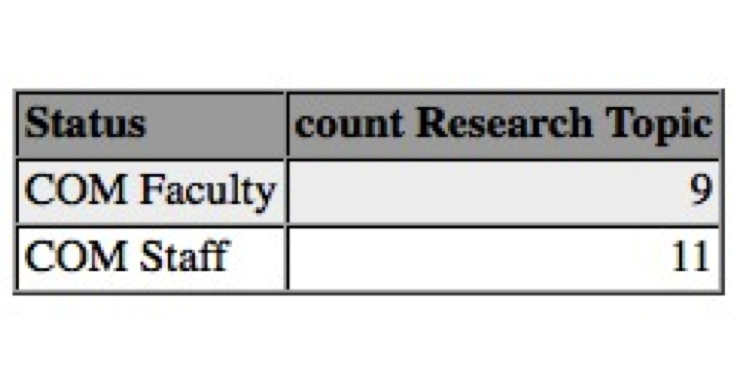
This is another example of querying the spreadsheet connected to my library’s Literature Search request form. The following query asks the spreadsheet to count the number of literature search requests by Research Topic (=column I) that were received in 2011 (=column G) grouped by the values in the column C, i.e. College of Medicine Faculty or College of Medicine Staff.
- select C, count(I) where (G contains ‘2011’) group by C
C. More Querying Options
There are many more things you can do with a custom query. Google has an extensive documentation that is easy to follow: https://developers.google.com/chart/interactive/docs/querylanguage#Language_Syntax
These are just a few examples.
- ORDER BY __ DESC
: Order the results in the descending order of the column of your choice. Without ‘DESC,’ the result will be listed in the ascending order. - LIMIT 5
: Limit the number of results. Combined with ‘Order by’ you can quickly filter the results by the most recent or the oldest items.
My presentation slides given at the 2013 LITA Forum below includes more detailed information about Google Visualization API Query Language, parameters, and other options as well as how to use Google Chart Libraries in combination with Google Visualization API Query Language for data visualization, which is the topic of my next post.
Happy querying Google Spreadsheet!
Pingback: Query a Google Spreadsheet like a Database with...
Huge interest, but obsolete now unfortunately. URLS have changed.
If you can update it, I’d be really really interested.
As far as I can tell, all links are working. If you have a specific link, please let me know.
Update: The new version of Google Spreadsheet appears to no longer support the direct output of the spreadsheet content into the HTML table with a url parameter. (Google spreadsheets created before the Google update work fine; only newly created spreadsheets have issues.) This can be seen when one applies the old parameter to the new version of Google spreadsheet. Google automatically redirects the page to the data table view ignoring the ‘tqx=out:html’ parameter. (e.g. https://docs.google.com/spreadsheets/d/1Ou5MQYkUL42Om_JViVKvhNpdkmjJjZygSqAORW4D5js/gviz/tq?tqx=out:html&tq=select+sum%28B%29+pivot%28C%29 redirected from https://spreadsheets.google.com/tq?tqx=out:html&tq=select%20sum%28B%29%20pivot%28C%29&key=1Ou5MQYkUL42Om_JViVKvhNpdkmjJjZygSqAORW4D5js ) There is a chance that maybe the newer version will support HTML output by the url parameter. But my guess is that they will no longer be supported.
Instead of using a URL parameter, I suggest using the Google Visualization API to output the HTML table (and other chart types) from a Google spreadsheet. This is covered in my presentation linked above (see slide 21 and after.) This will continue to be supported. (Note the ‘/gviz/’ in the new version of Google Spreadsheet url.)
A stopgap measure – if you do not want to use the Google Visualization API – is to create your spreadsheet in the old version at https://g.co/oldsheets. But I do not recommend it. More information about new Google Sheets is at https://support.google.com/docs/answer/3541068?p=new_google_sheets&rd=1.